Static Maps
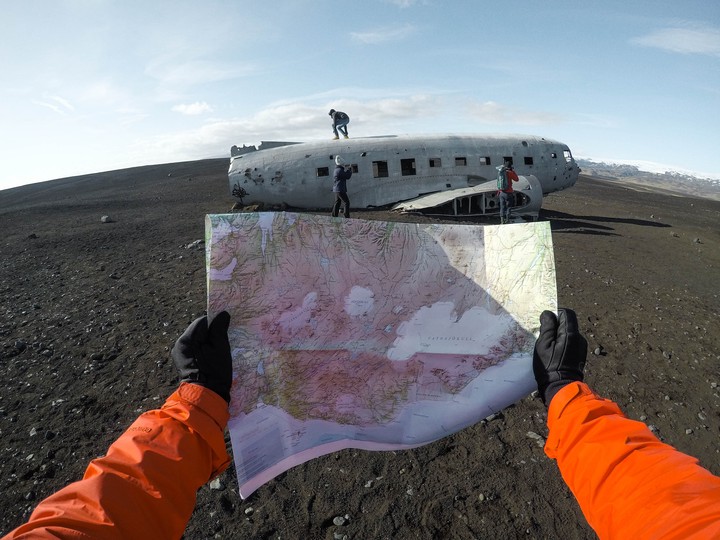 Photo by Jeremy Bishop on Unsplash
Communication using maps
A map tells a story. The ultimate goal of any spatial data analysis or research is to communicate the key outputs. Visualization of spatial data inform of maps comes in handy when sharing useful insights that inform critical decision making.
Here, I would like to share my experience of spatial data visualization from different data analysis problems.
Regions of interest(ROI)
When doing a study/analysis involving a specific area(s) given a broader geographic location, you might be required to display a particular region(s) of interest. This map shows a case of areas of interest at the county level in Kenya from counties shapefile data.
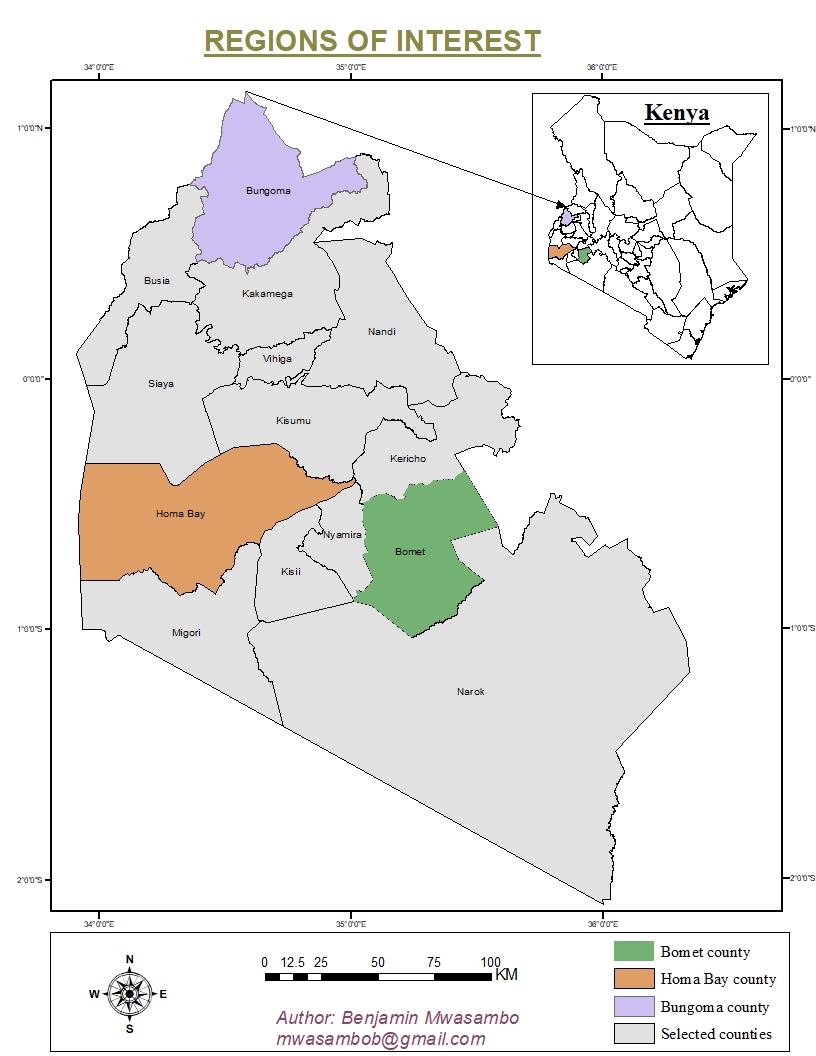
Figure 1: Regions of Interest
Parcels distribution within sub-counties
Parcels (point features) are distributed within polygon features(sub-counties boundaries). Point features can be schools, shops, hospitals, events occurring, e.t.c. Information on both points and polygons is stored in attributes.
The map below shows that parcels are located exclusively in the selected sub-counties. Such information is relevant. It gives insights that can be used for planning purposes or service delivery since we are narrowing down from more comprehensive geographic location(County level) to sub-counties level.
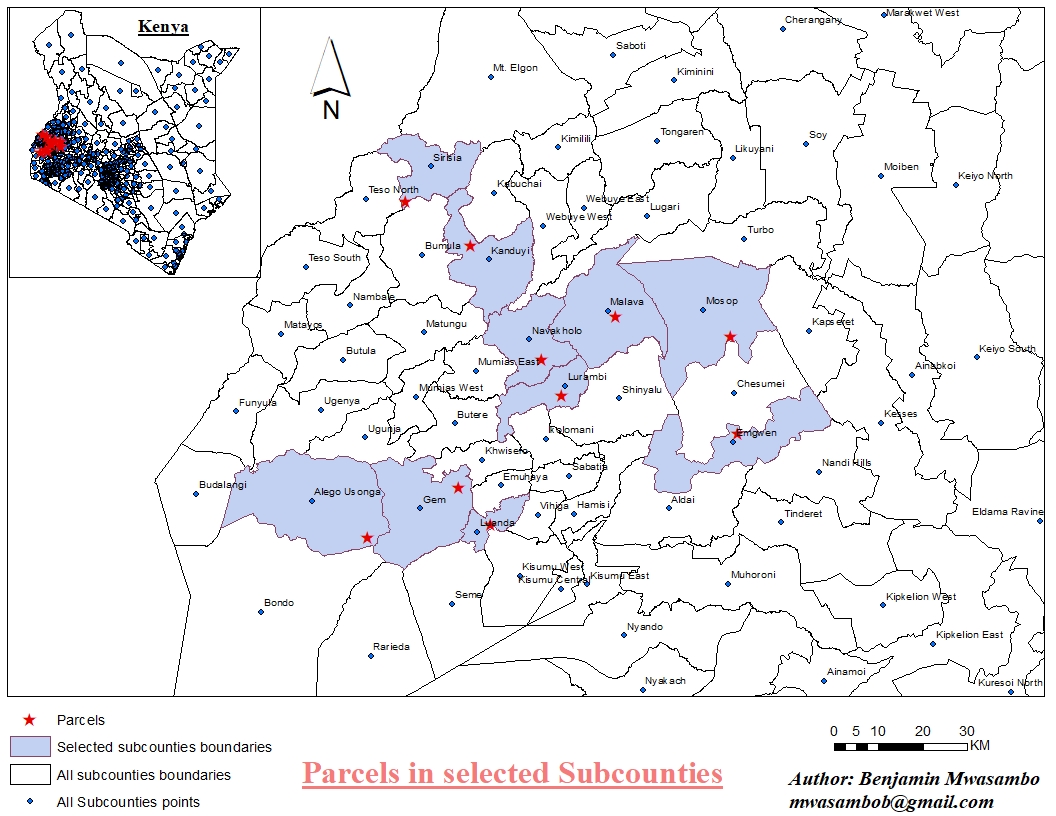
Figure 2: Point features distribution
Regional customers purchase segmentation
You might want to understand the cumulative customers’ purchase within your customers’ regional coverage. Total sales data can as well be displayed on a map and variations color-coded.
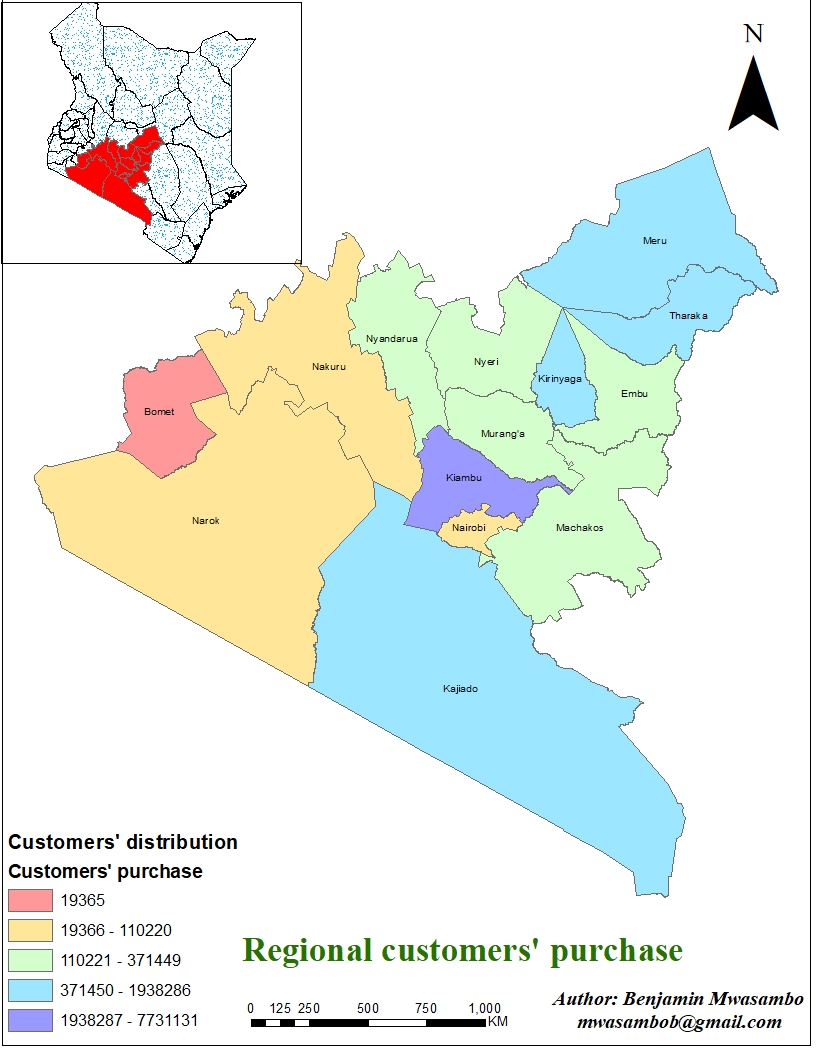
Figure 3: Regional customers purchase
Humanitarian response to Cyclone Idai in Zimbabwe
This map links to my project about humanitarian organizations’ efforts in response to the devastating cyclone Idai in Zimbabwe in March 2019. An excellent example of a choropleth map showing individuals reached at the district level.
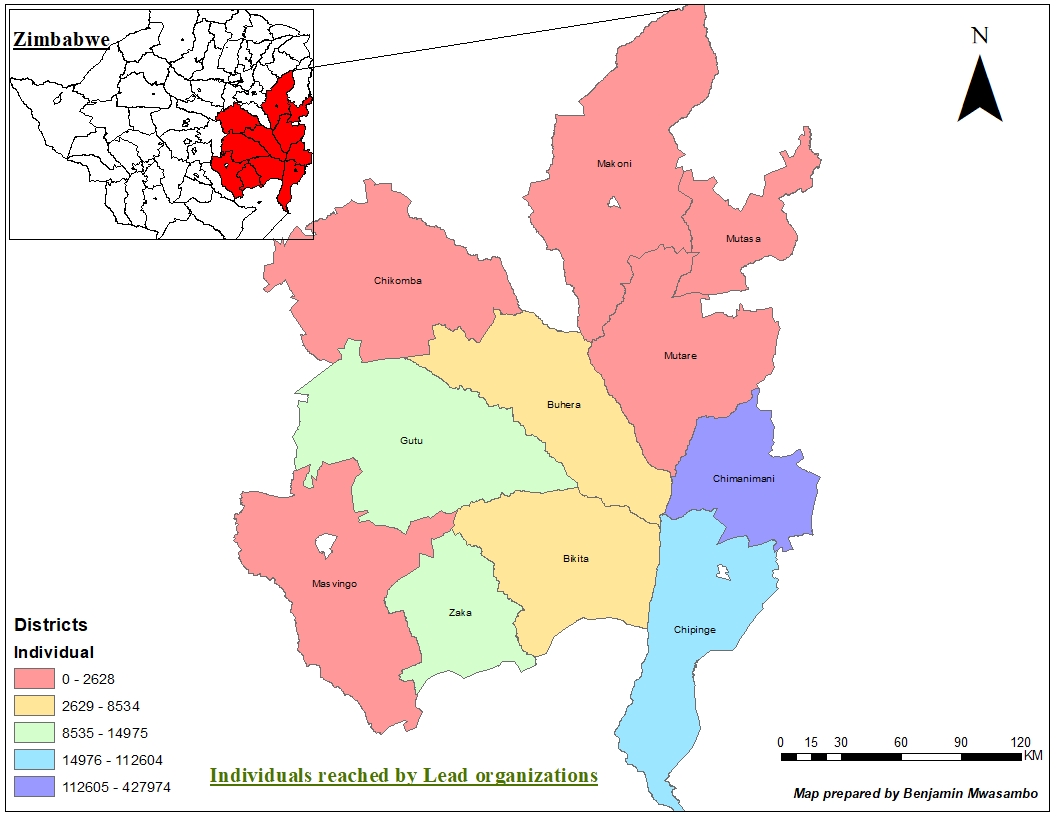
Figure 4: Humanitarian response map
More maps coming soon….