Time series market Price analysis for different agricultural commodities in Kenya
 Photo by Sonja Langford on Unsplash
The selling of agricultural produce to consumers is one of the crucial stages in the agricultural value chain. However, the chain actors; producers(farmers), traders, and consumers may lack sufficient information about prevailing and historical regional market prices.
This analysis shows trends for agricultural commodities prices in different regions from January 2018 to April 2020. Daily data was downloaded from NAFIS website. Many thanks to Peris Bosire for conducting extensive market data research and advising on these datasets’ usage.
Averages for monthly market prices in each region were used to analyze the trends. Rigorous cleaning of the data, which includes merging daily data files, was done, and the final ‘clean data’ was used for this analysis. However, a gap in data acquisition was observed from December 2018 to April 2020.
Only a few regions and commodities(with sufficient data) were selected for this analysis.
One caveat: Imputation of row means was done for commodities with missing price values.
RM = rowMeans(clean_data[, 6:26], na.rm = TRUE)

#Missing row values for Nairobi

clean_data$Nairobi[is.na(clean_data$Nairobi)] = RM[is.na(clean_data$Nairobi)]
Data acquisation dates were also converted to Month-Year.
library(lubridate)
clean_data$Date <- as.Date(clean_data$Date, format = "%Y-%m-%d")
clean_data$Month <- format(as.Date(clean_data$Date), "%b - %Y")
clean_data$Month <- factor(clean_data$Month,
                        levels = c("Jan - 2018", "Feb - 2018", "Mar - 2018", "Apr - 2018", "May - 2018", "Jun - 2018",
                                   "Jul - 2018", "Aug - 2018", "Sep - 2018", "Oct - 2018", "Nov - 2018",
                                   "Jan - 2019","Mar - 2019", "Apr - 2019", "May - 2019","Aug - 2019", "Feb - 2020",
                                   "Mar - 2020", "Apr - 2020"))
A glimpse of the data used for analysis
#show sample dataset used for analysis
library(dplyr)
library(knitr)
summary <- clean_data[, 1:8] %>%
  head(6)
summary %>%
kable("html", caption = 'A summary of the dataset')| Month | Commodity | Nairobi | Mombasa | Kisumu | Nakuru | Eldoret | Kisii |
|---|---|---|---|---|---|---|---|
| Apr - 2018 | Avocado | 2300 | 3500 | 1800 | 2185 | 2314 | 1637 |
| Apr - 2018 | Beans Canadian | 7200 | 7106 | 8342 | 7200 | 7106 | 7106 |
| Apr - 2018 | Beans Mwitemania | 6750 | 5564 | 6429 | 5500 | 8100 | 6429 |
| Apr - 2018 | Cabbages | 1660 | 2717 | 1250 | 1071 | 1564 | 1534 |
| Apr - 2018 | Dry Maize | 2800 | 2535 | 3514 | 2500 | 2392 | 2685 |
| Apr - 2018 | Eggs | 324 | 330 | 330 | 300 | 333 | 325 |
1.Market prices for commodities sold in Nairobi
The majority of the commodities have shown a one-year steady price decrease (from January 2018 to January 2019), followed by a tremendous upward shift in prices between January and August 2019. Relatively constant prices were recorded in the first four months of 2020. Tomatoes had variations in prices across the analysis period, with the highest price recorded in June 2018, at KSh. 7,000 per box(64Kg).
When the price of green maize was comparatively high, a dry maize bag was sold at a lower price and vice versa. The two varieties of beans have a uniform trend where a bag of beans canadian was sold at a higher price throughout the seasons.
#plot for Nairobi

library(ggplot2)
library(knitr)
library(dplyr)

Nairobi <-  ggplot(clean_data, aes(x= Month, y=Nairobi, group=Commodity)) +
  geom_line(aes(color=Commodity))+
  geom_point(aes(color=Commodity))+ ylab("Market prices (KSh)")+
  xlab("Month-Year")+theme(axis.text.x = element_text( size=8, angle=60, color="black"))+
  ggtitle("Time series monthly averaged market prices for selected commodities in Nairobi")+
  theme(plot.title = element_text( colour = "#663300"))+
  scale_y_continuous(labels = label_comma(big.mark = ","))+
  theme(legend.position="top")

Nairobi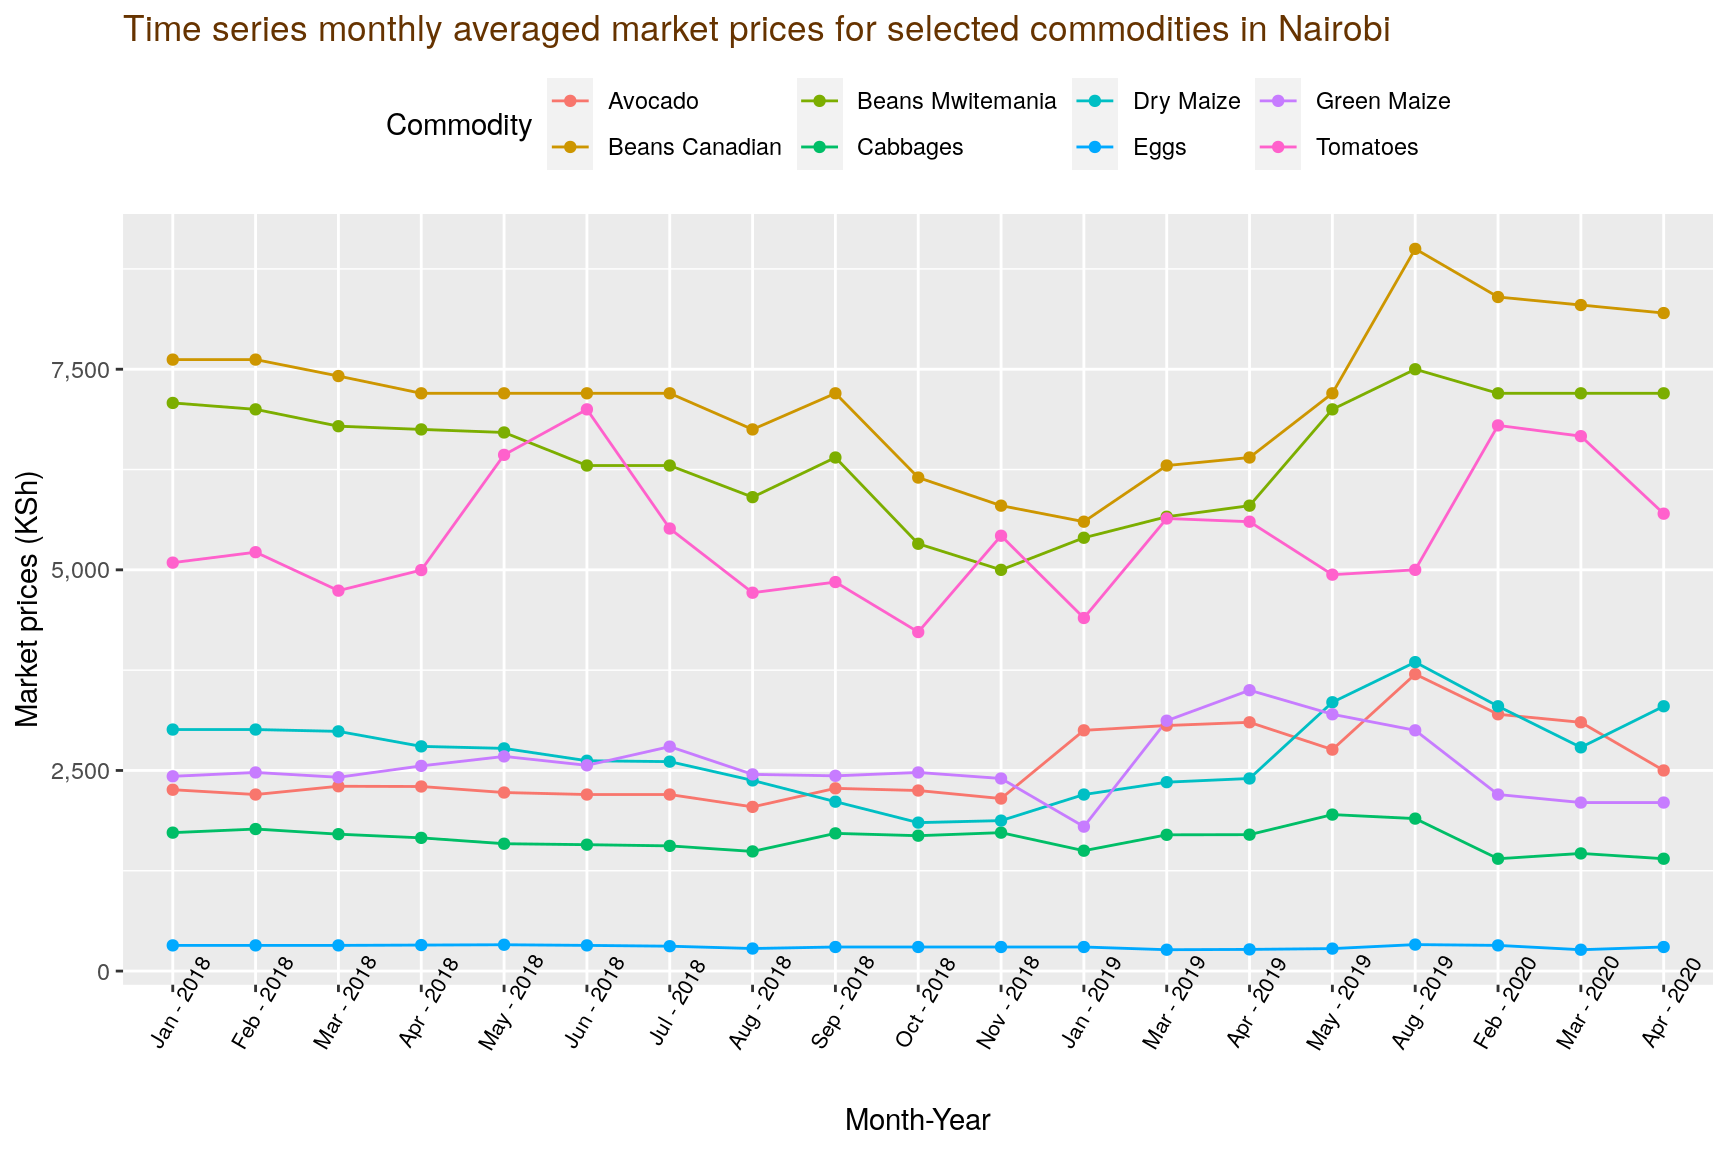
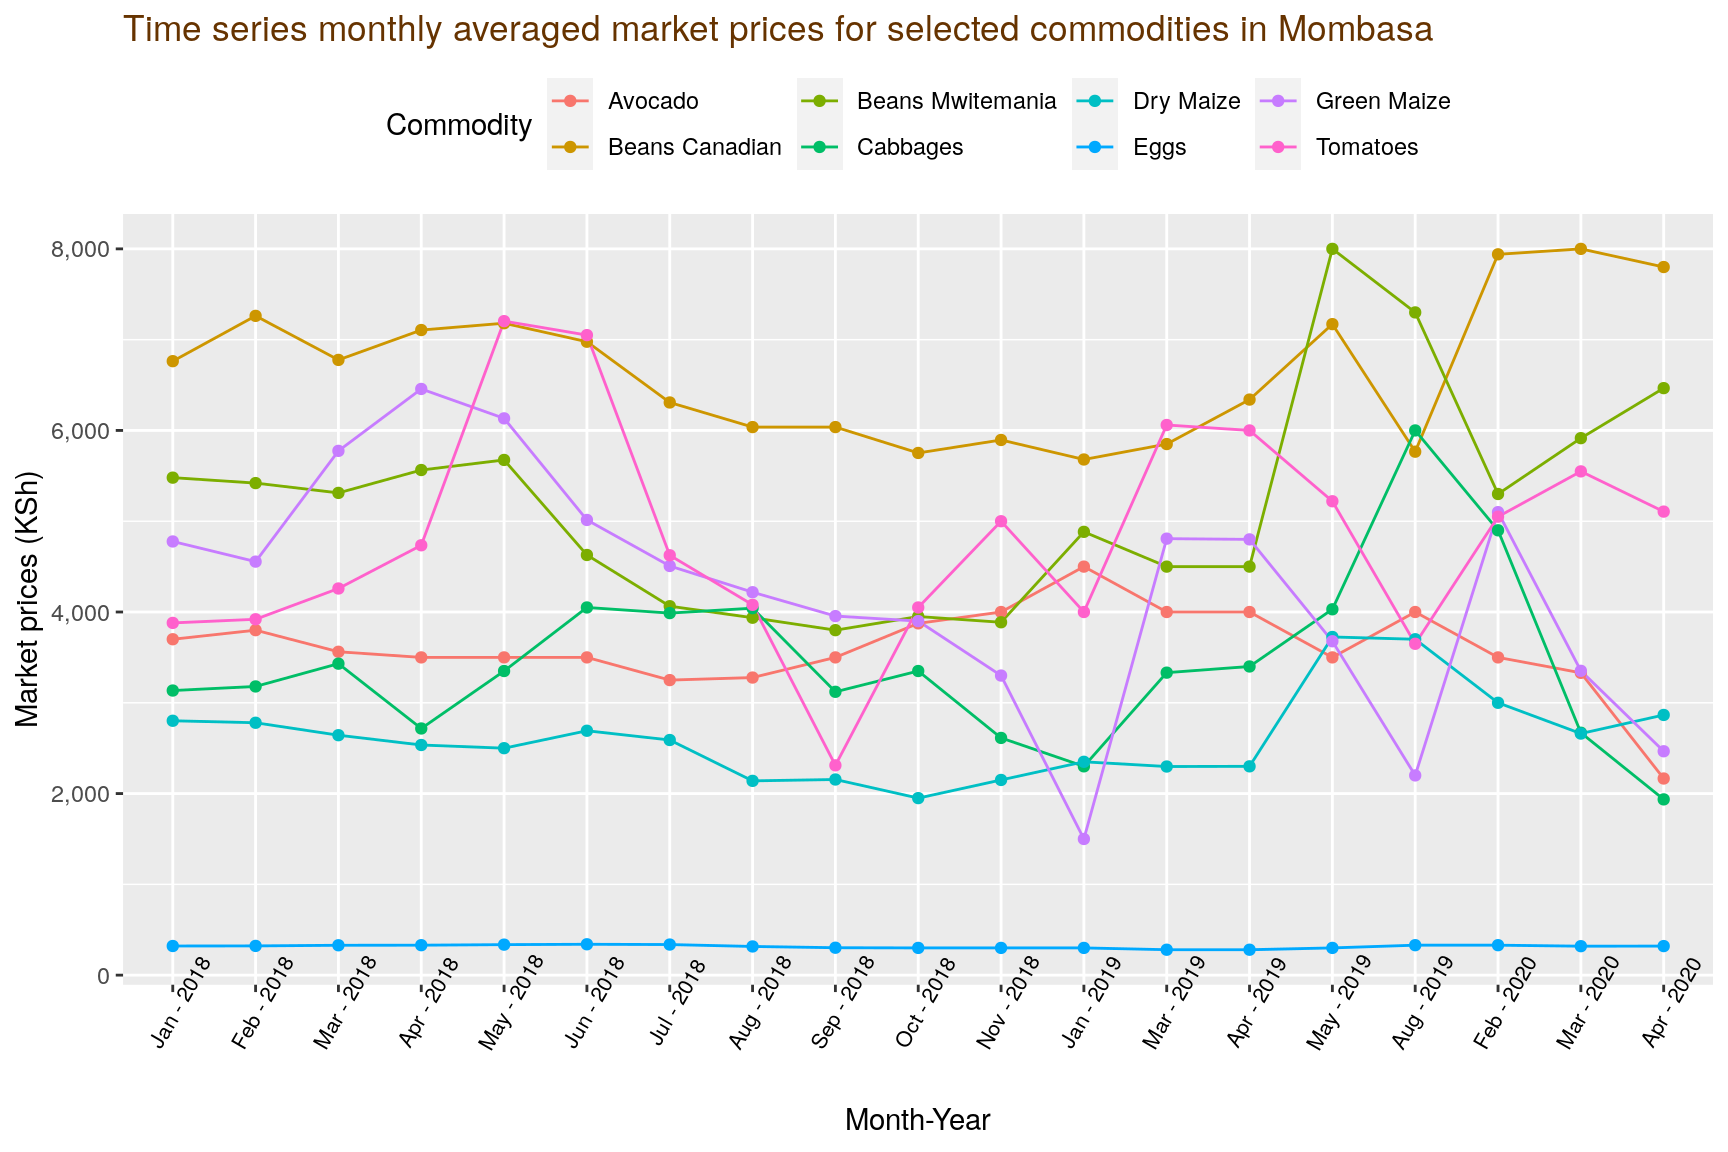
2.Market prices for commodities sold in Mombasa
Prices for commodities in Mombasa appeared to be highest compared to other towns. All commodities except eggs were sold at more than KSh.2,000 per unit. The prices of green maize were significantly higher compared to dry maize. A bag of dry maize was sold at a lower cost compared to other commodities throughout the months. However, Avocados recorded the highest prices in Mombasa compared to other towns; a bag was sold above KSh. 3,500 in all Months.
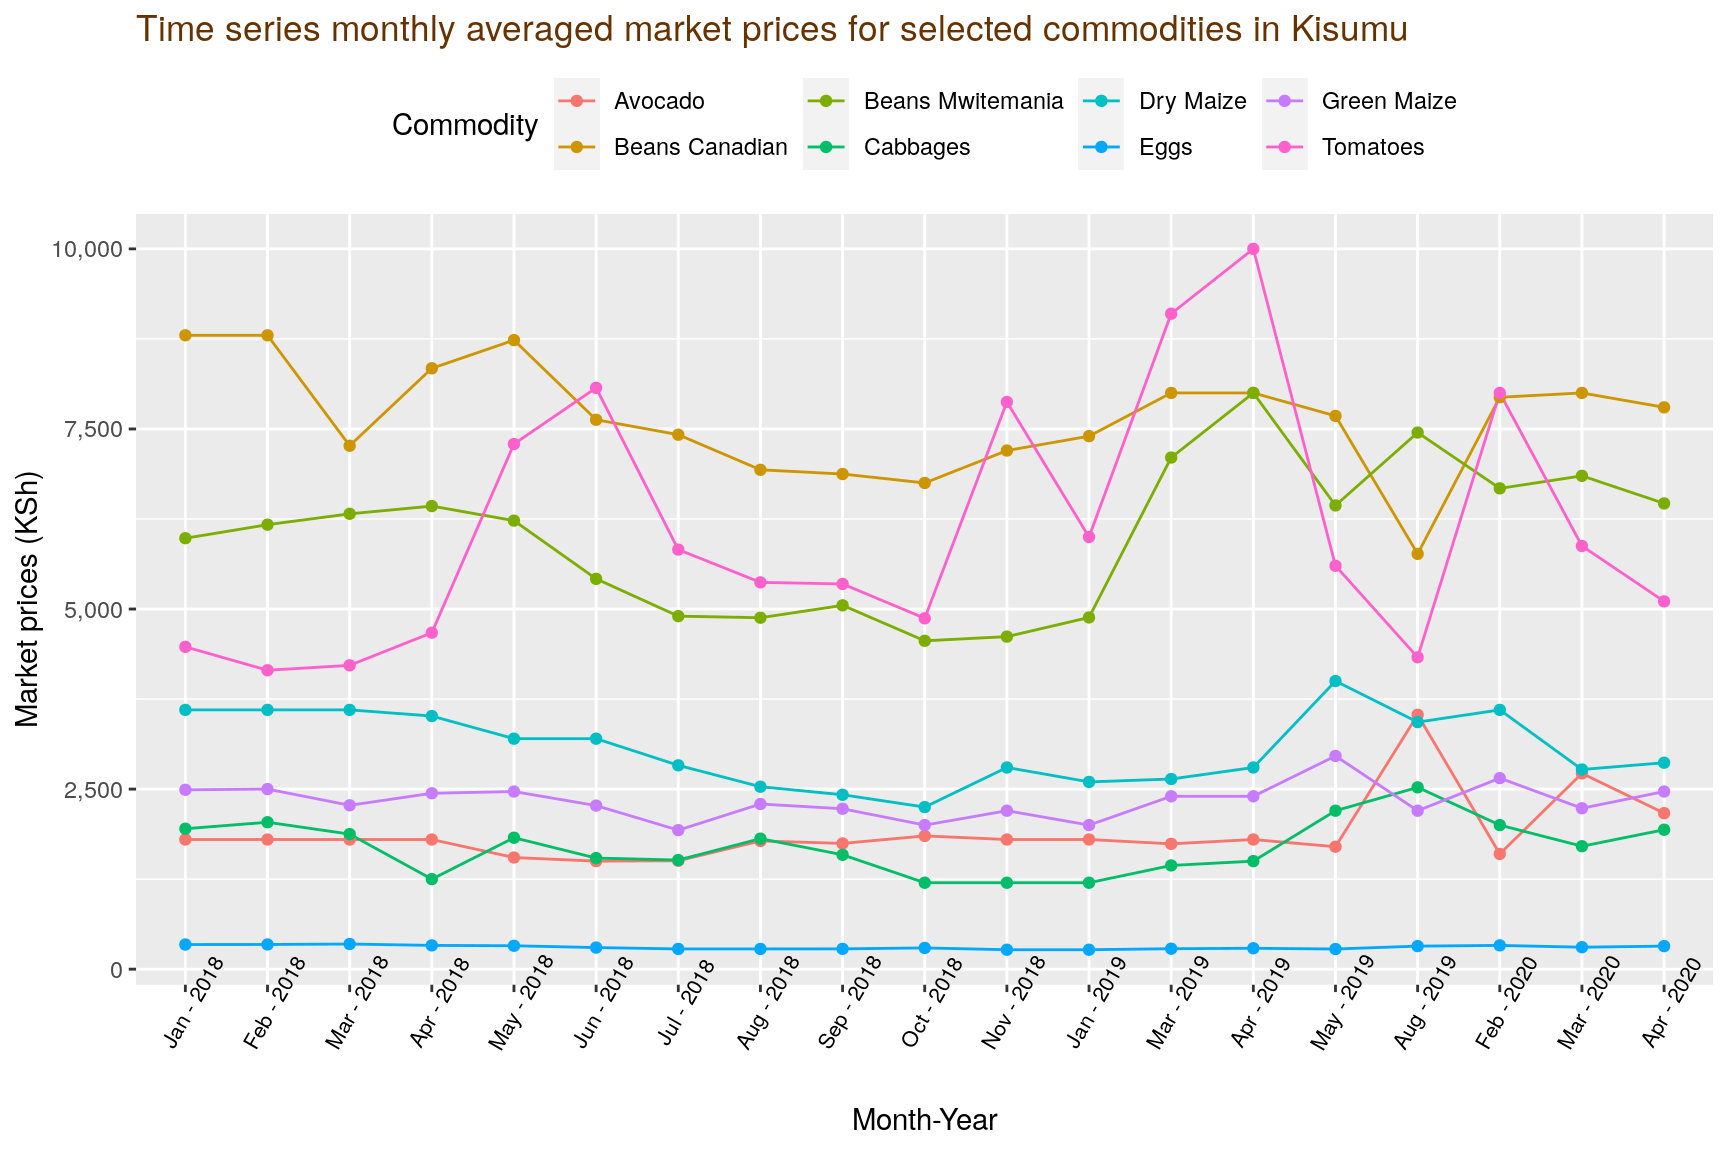
3.Market prices for commodities sold in Kisumu
A bag of dry maize was sold at a slightly higher cost than that of green maize throughout the seasons in Kisumu. This shows a unique trend compared to other towns, where a bag of green maize was sold at higher prices than that of dry maize. Tomatoes were also sold at comparatively higher prices, recording up to KSh.10,000 per box in April 2019.
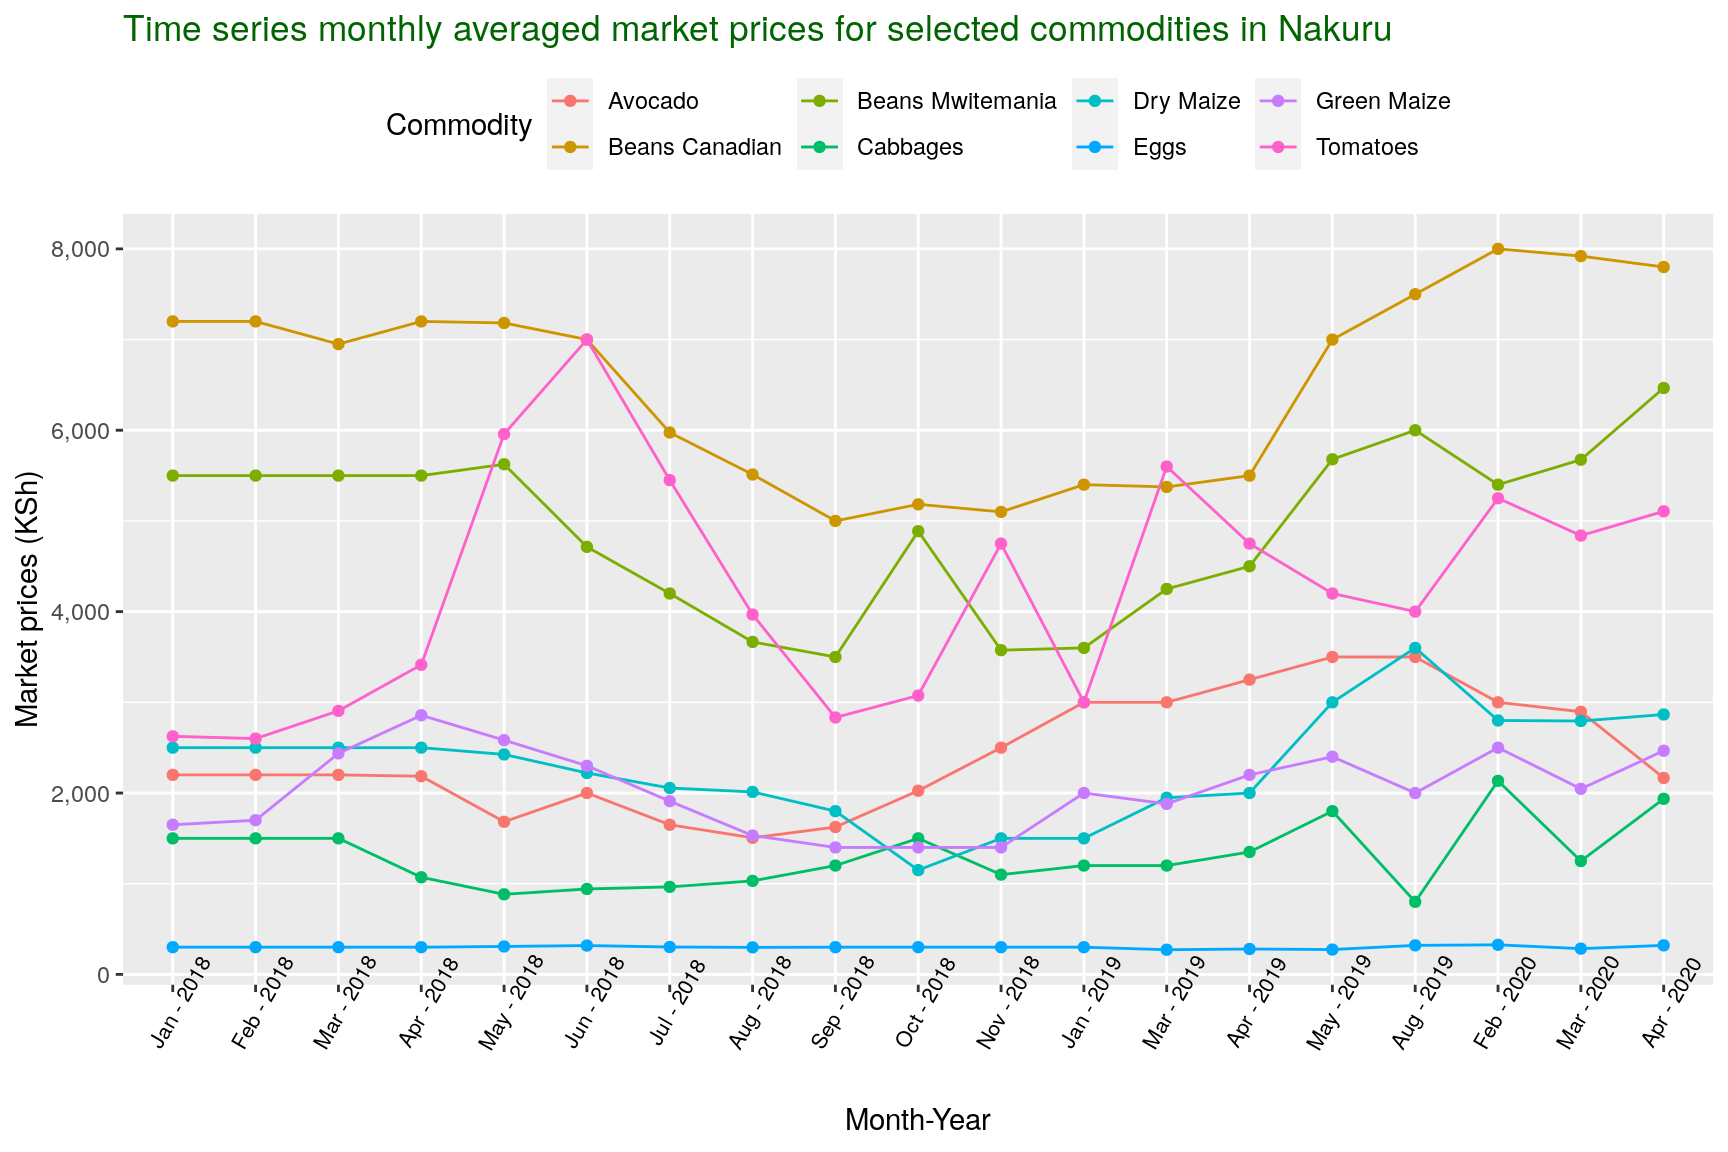
4.Market prices for commodities sold in Nakuru
A bag of cabbages (126Kg)was sold at the lowest prices in Nakuru- as low as KSh.800 compared to other
towns.
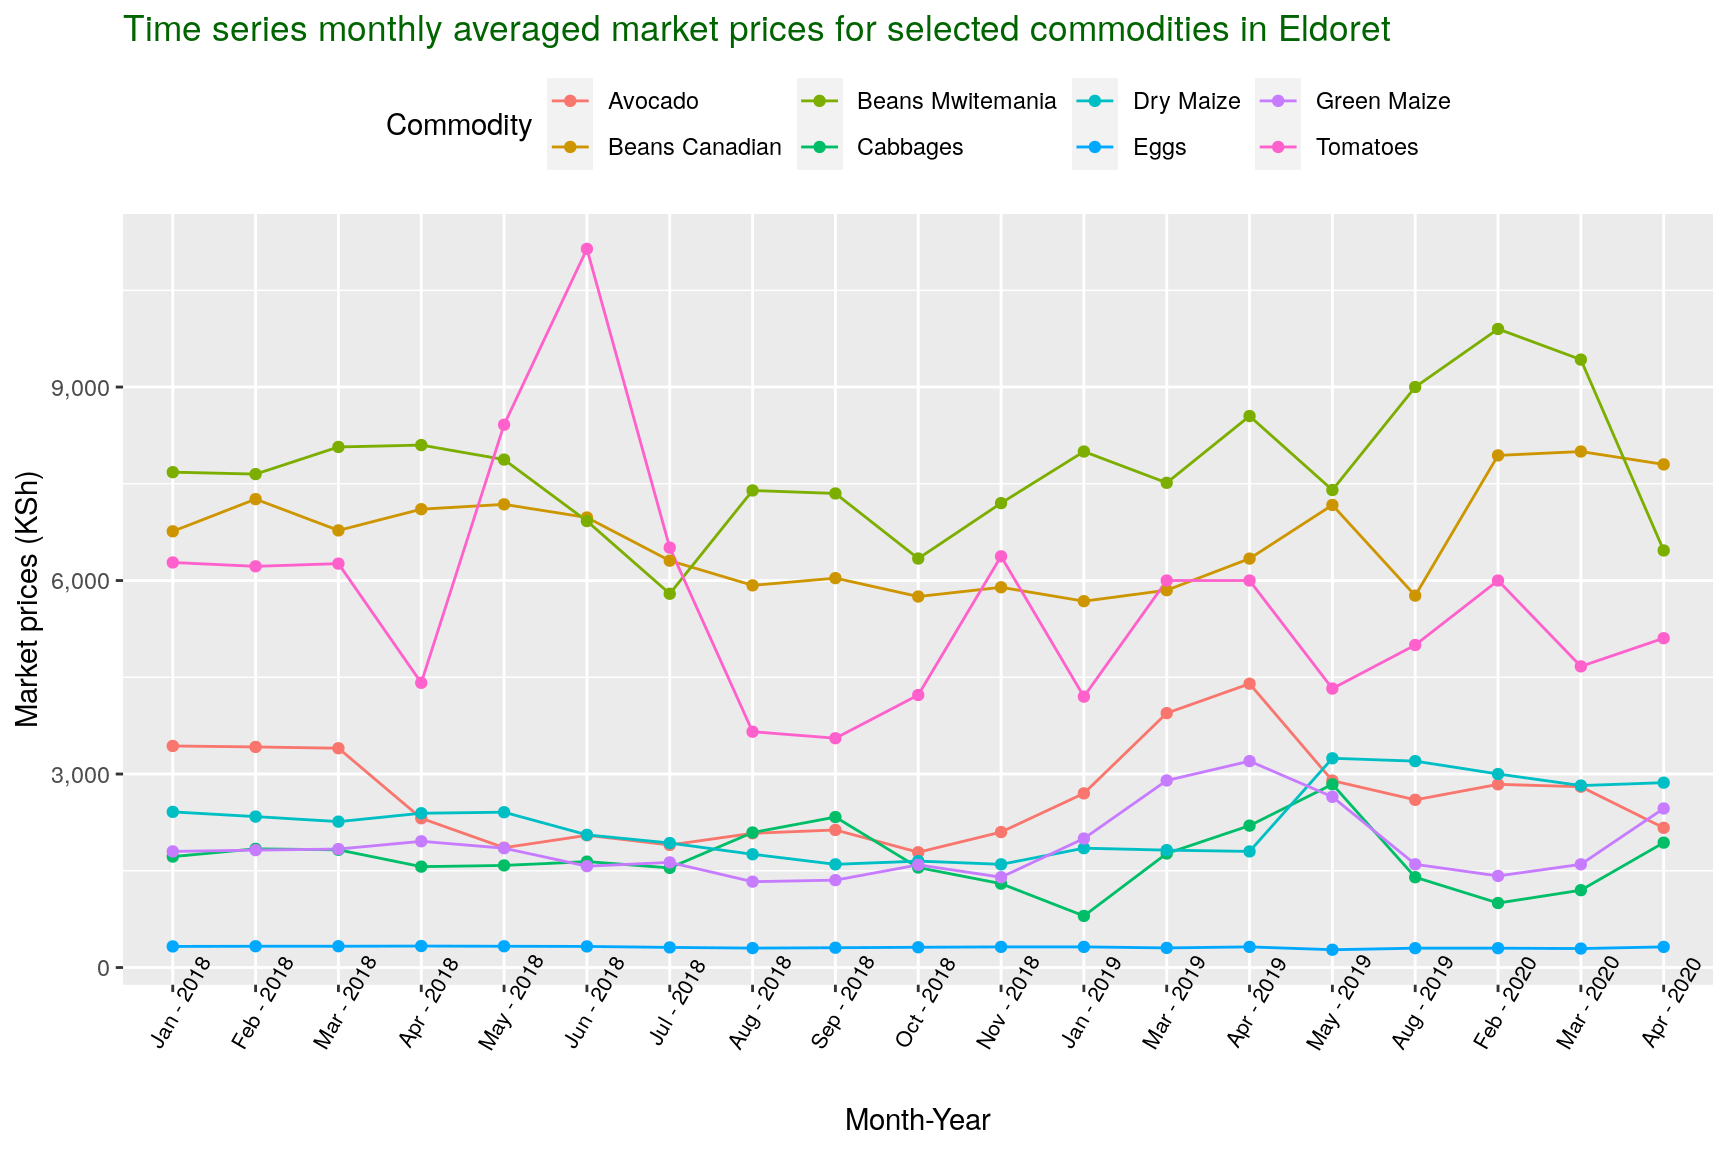
5.Market prices for commodities sold in Eldoret
A unique trend was observed in Eldoret, where the cost of beans Mwitemania variety was higher compared to that of beans Canadian across all months except July 2018. The highest recorded price of tomatoes per box (64Kg box)was observed in June 2018 at KSh.11,142.
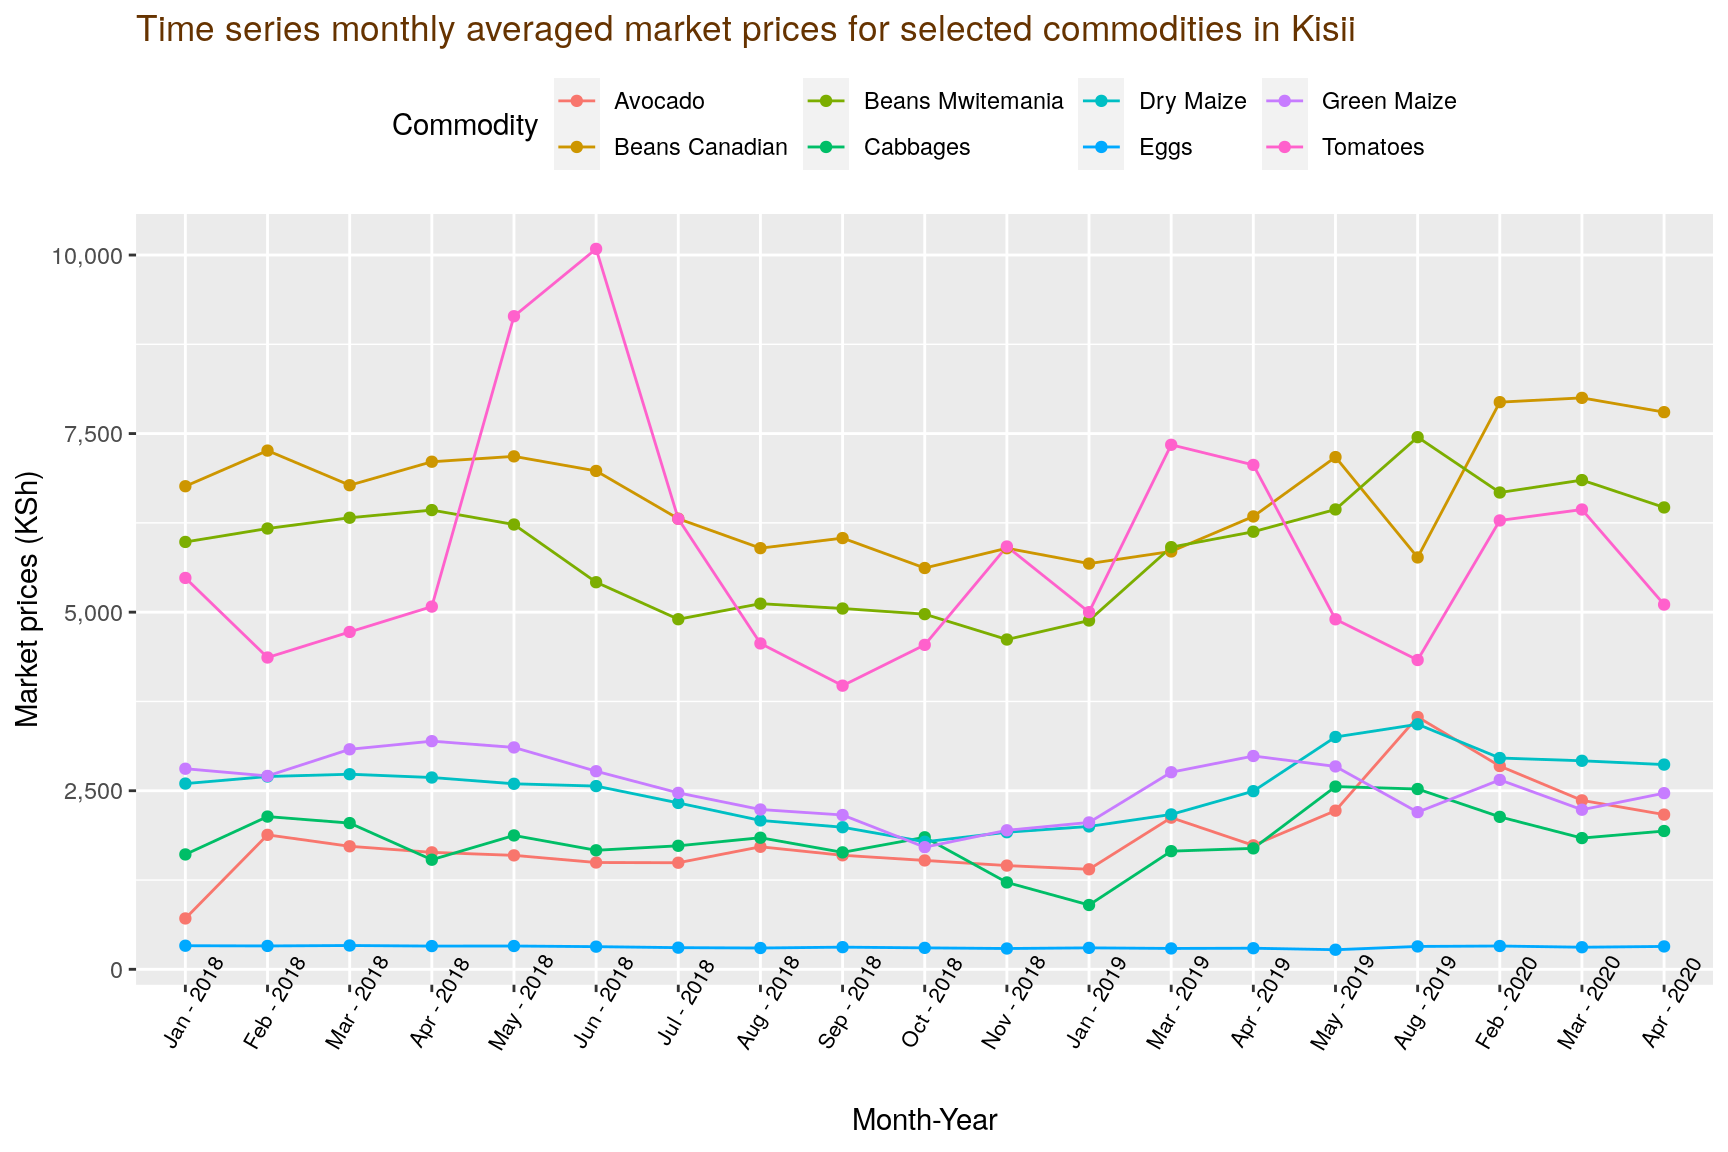
5.Market prices for commodities sold in Kisii
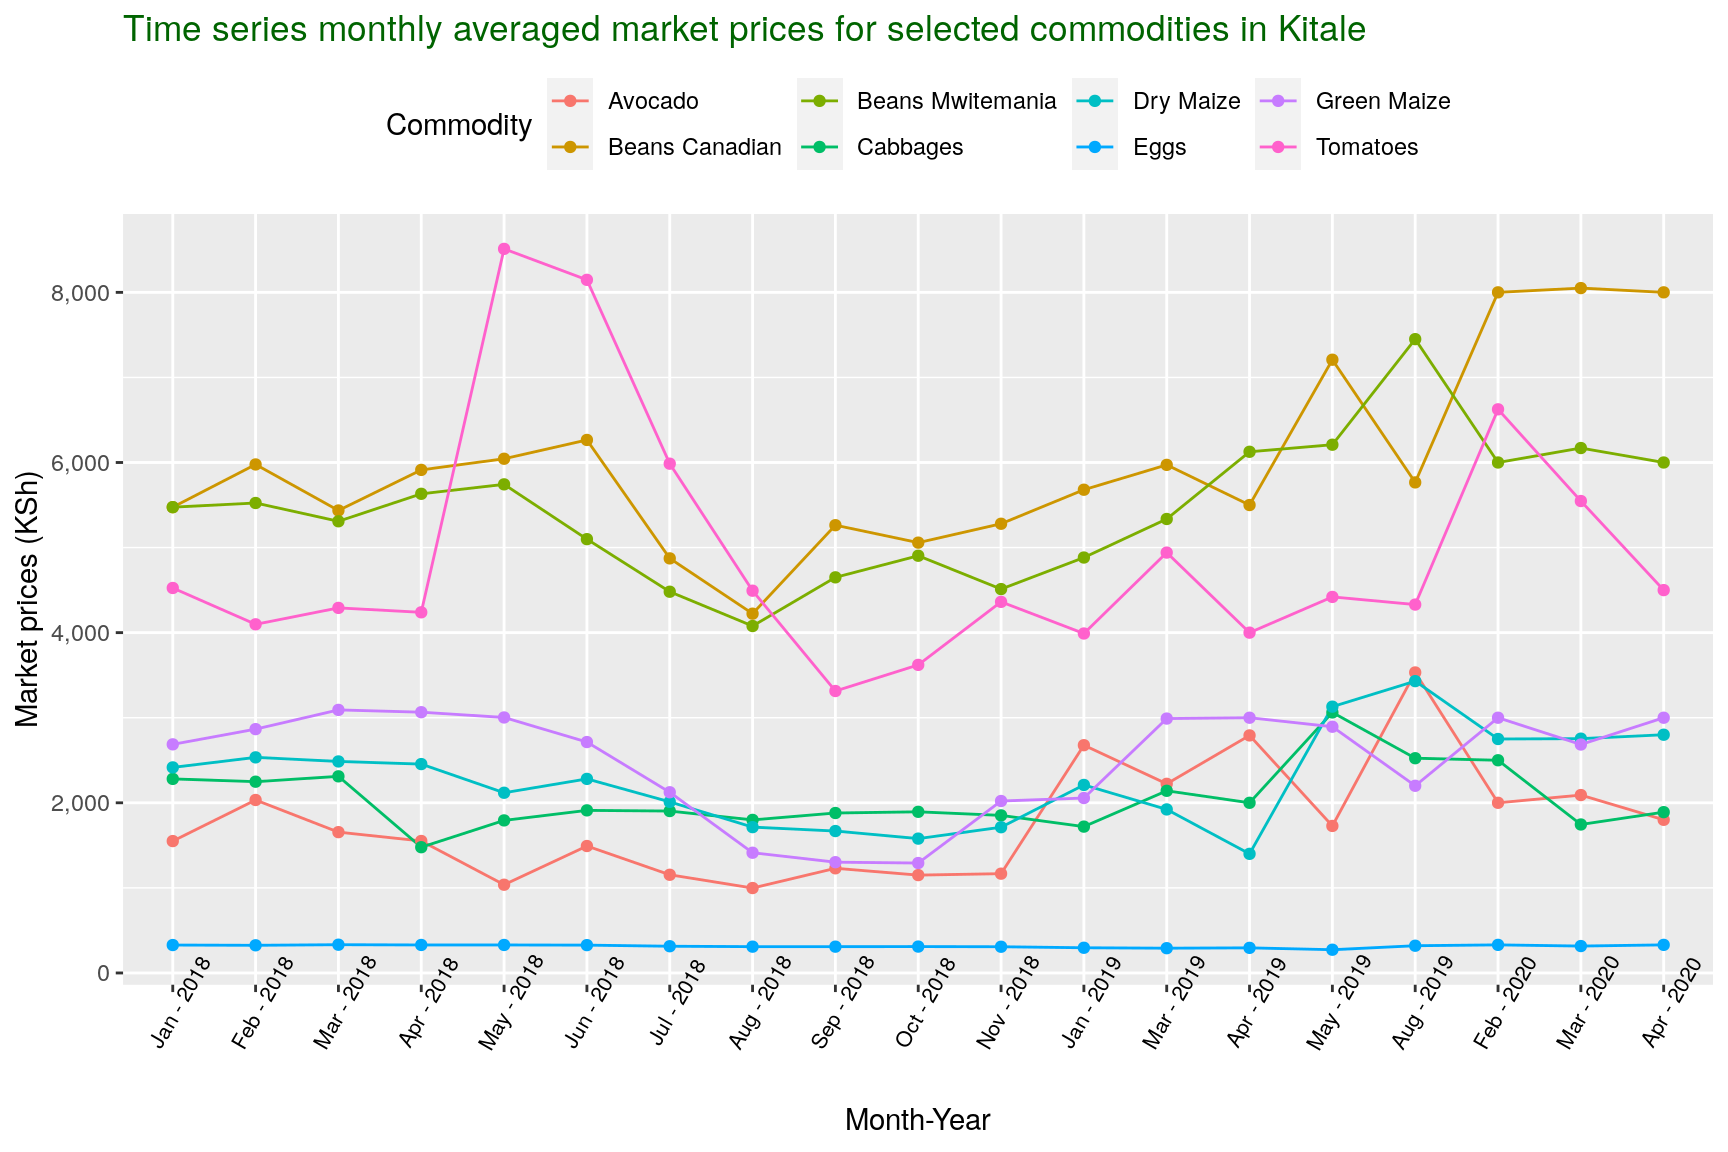
6.Market prices for commodities sold in Kitale
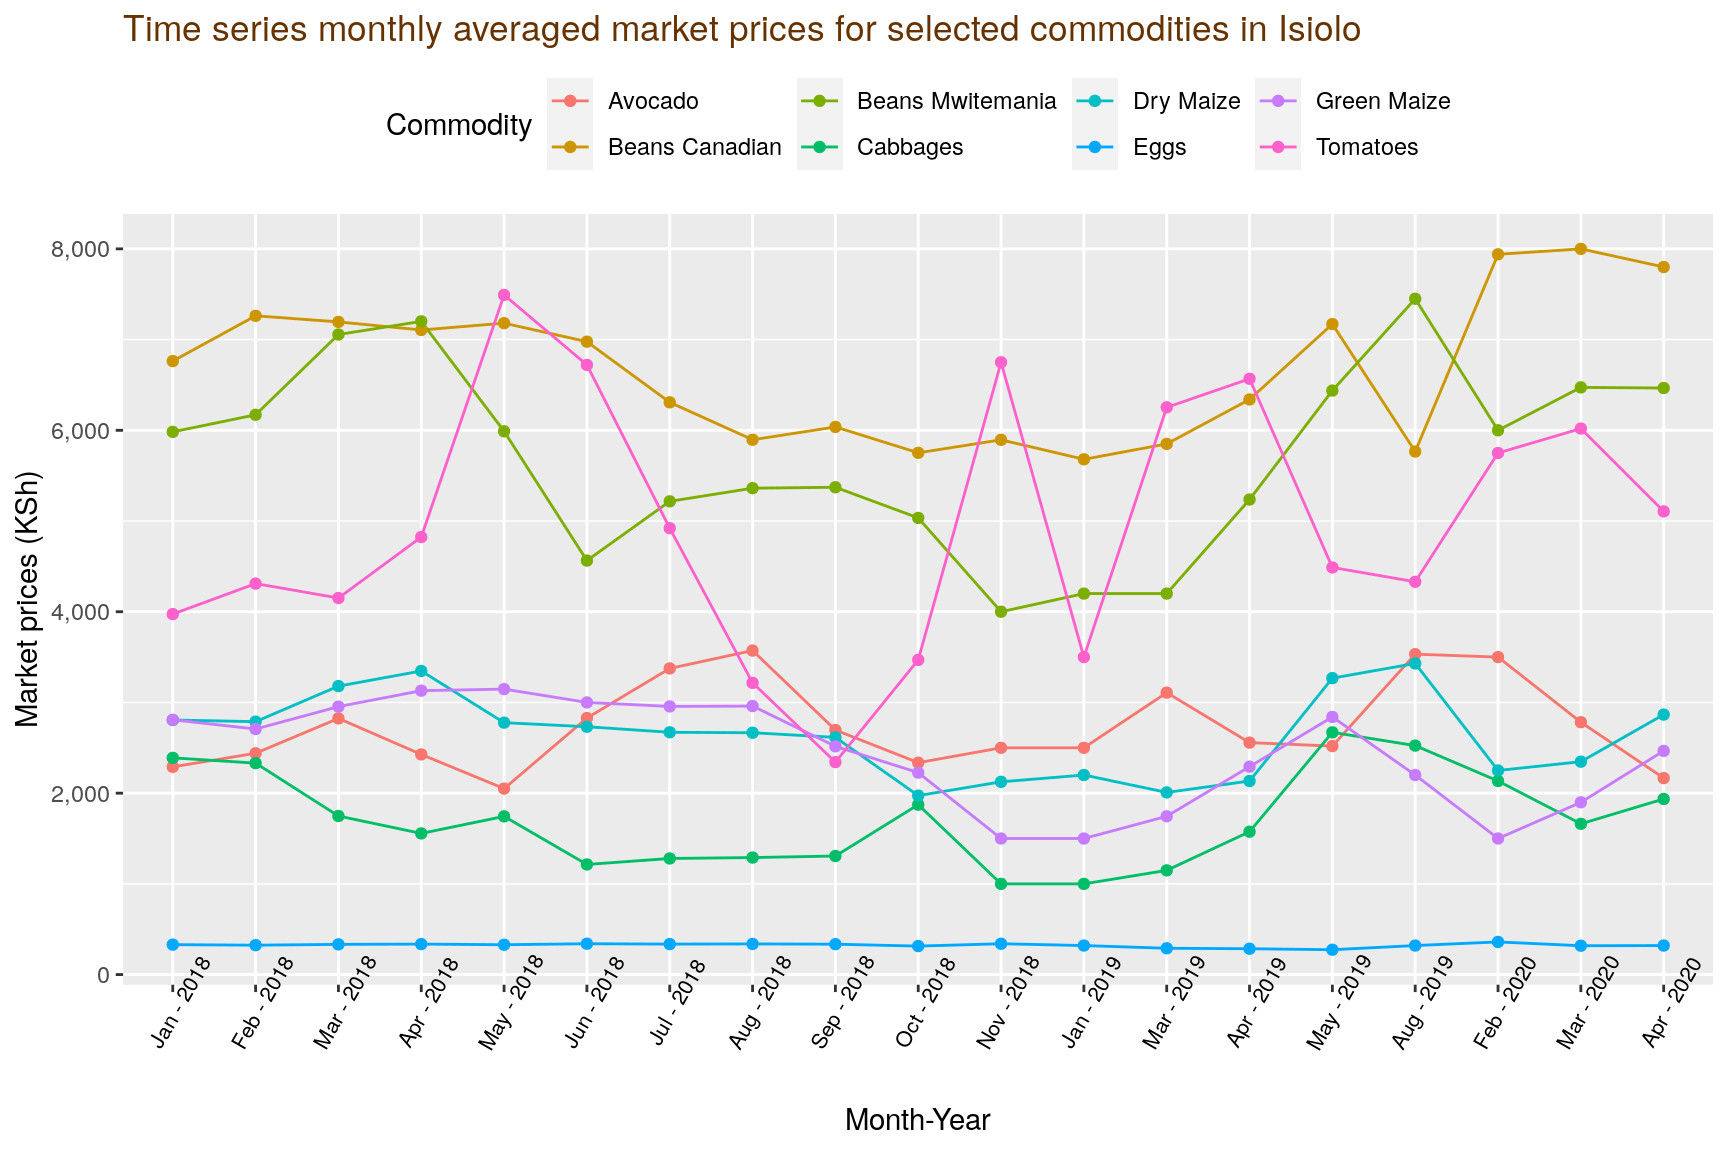
7.Market prices for commodities sold in Isiolo
Summary
The trend analysis shows different commodities’ prices behavior in various towns throughout the analysis period in a nutshell. There is a clear distinction in the recorded commodities; the following top 3 items were sold at more than KSh.3,000 per unit.
- Beans Canadian
- Beans Mwitemania
- Tomatoes
There was an overall tomato price spike in June 2018 in all towns. The average prices ranged from 7,000-11,142 (KSh.) per box sold.